Image Details
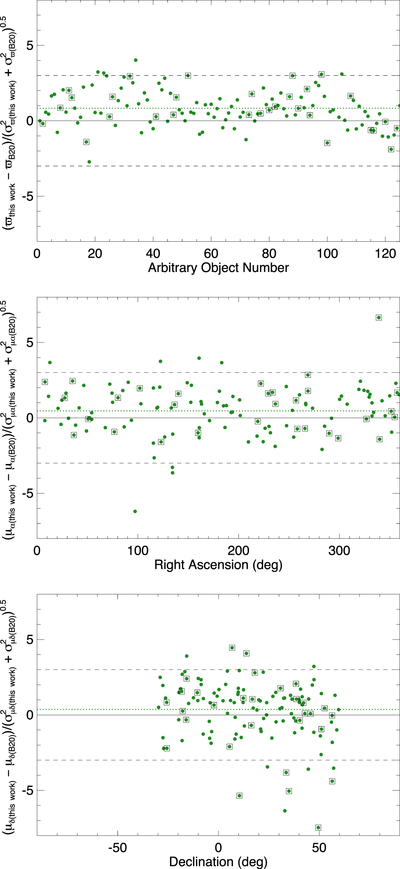
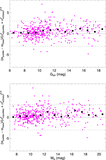
Caption: Figure 8.
Comparison of the astrometric results from this paper to those from Best et al. (2020), for the 124 objects (green points) in common. Mean offsets along the y-axis are shown by the dotted green line; the dashed black lines show 3σ excursions. Objects with ﹩{\chi }_{\nu }^{2}﹩ values of 1.5 or greater in either work are marked by squares and are not included in the computation of the mean.
Other Images in This Article


Show More
Copyright and Terms & Conditions
© 2021. The American Astronomical Society. All rights reserved.
Copyright ©
2025 Astronomy Image Explorer. All Rights Reserved.