Image Details
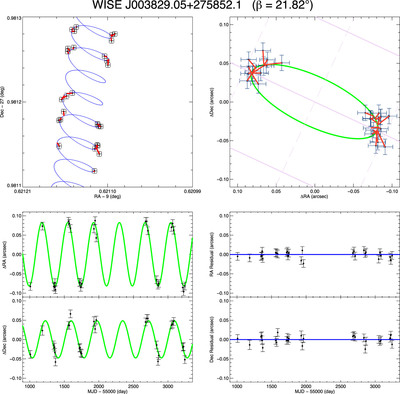
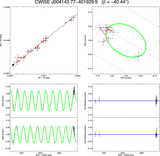
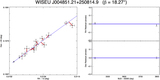
Caption: Figure 1. Astrometric fits to the 361 objects in the Spitzer parallax program
The complete figure set (361 images) is available in the online journal.
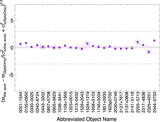
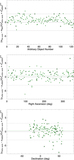
Example of a target whose astrometric fit uses only Spitzer data. (Upper left) A square patch of sky showing the measured astrometry and its uncertainty at each epoch (black points with error bars) plotted in R.A. vs. decl.. Blue curve shows the best fit. Red lines connect each observation to its corresponding time point along the best-fit curve. (Upper right) A square patch of sky centered at the mean equatorial position of the target. Green curve is the parallactic fit, which is just the blue curve in the previous panel with the proper motion vector removed. Again, red lines connect the time of the observation with its prediction. In the background is the ecliptic coordinate grid, with lines of constant β shown in solid pale purple and lines of constant λ shown in dashed pale purple. Grid lines are shown at 0![]() 1 spacing. (Lower left) The change in R.A. and decl. as a function of time with the proper motion component removed. The parallactic fit is again shown in green. (Lower right) The R.A. and decl. residuals from the fit as a function of time.
1 spacing. (Lower left) The change in R.A. and decl. as a function of time with the proper motion component removed. The parallactic fit is again shown in green. (Lower right) The R.A. and decl. residuals from the fit as a function of time.
Other Images in This Article

Show More
Copyright and Terms & Conditions
© 2021. The American Astronomical Society. All rights reserved.