Image Details
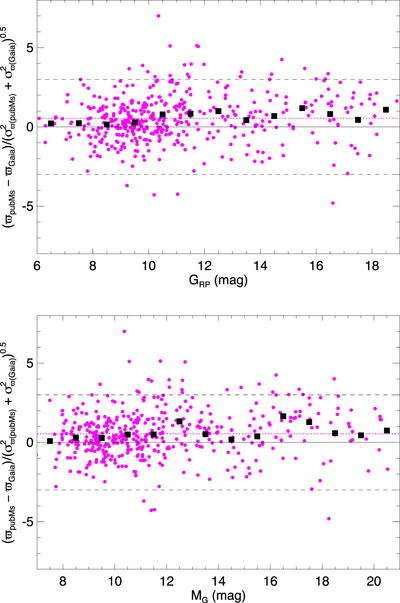
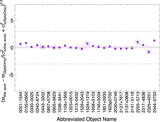
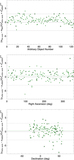
Caption: Figure 6.
Comparison of the Gaia DR2 astrometric results to other published astrometry for a wider range of spectral types (M0 to L8) than that shown in Figure 5 (see also https://www.pas.rochester.edu/~emamajek/EEM_dwarf_UBVIJHK_colors_Teff.txt). Mean offsets along the y-axis are shown by the dotted magenta line; dashed black lines show 3σ excursions. Black squares show the median values along integral magnitude intervals in apparent GRP magnitude (top panel) and absolute G magnitude (bottom panel). Trends suggest that the median offset increases with fainter apparent magnitude and with fainter absolute magnitude (which is used here as a proxy for color).
Other Images in This Article


Show More
Copyright and Terms & Conditions
© 2021. The American Astronomical Society. All rights reserved.