Image Details
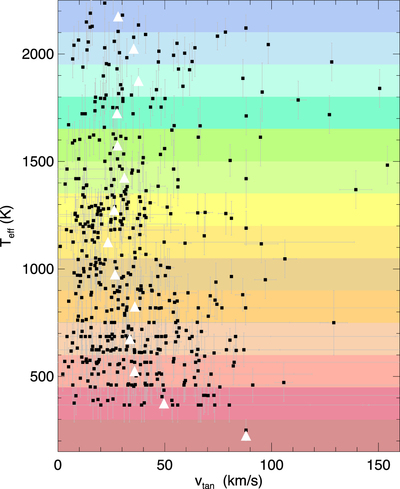
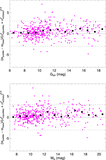
Caption: Figure 33.
Tangential velocities plotted against effective temperature for L, T, and Y dwarfs in the 20 pc census. Only those objects having parallax measurements with uncertainties <12.5% are shown. Individual objects are shown as black squares, and the median vtan values in each 150 K bin are shown as white triangles.
Other Images in This Article


Show More
Copyright and Terms & Conditions
© 2021. The American Astronomical Society. All rights reserved.
Copyright ©
2025 Astronomy Image Explorer. All Rights Reserved.