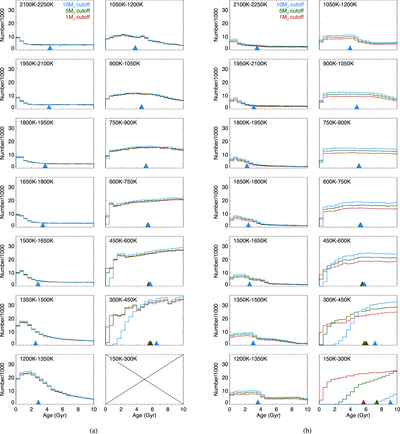
Image Details

Choose export citation format:

The Field Substellar Mass Function Based on the Full-sky 20 pc Census of 525 L, T, and Y Dwarfs

  • Authors: J. Davy Kirkpatrick, Christopher R. Gelino, Jacqueline K. Faherty, Aaron M. Meisner, Dan Caselden, Adam C. Schneider, Federico Marocco, Alfred J. Cayago, R. L. Smart, Peter R. Eisenhardt, Marc J. Kuchner, Edward L. Wright, Michael C. Cushing, Katelyn N. Allers, Daniella C. Bardalez Gagliuffi, Adam J. Burgasser, Jonathan Gagné, Sarah E. Logsdon, Emily C. Martin, James G. Ingalls, Patrick J. Lowrance, Ellianna S. Abrahams, Christian Aganze, Roman Gerasimov, Eileen C. Gonzales, Chih-Chun Hsu, Nikita Kamraj, Rocio Kiman, Jon Rees, Christopher Theissen, Kareem Ammar, Nikolaj Stevnbak Andersen, Paul Beaulieu, Guillaume Colin, Charles A. Elachi, Samuel J. Goodman, Léopold Gramaize, Leslie K. Hamlet, Justin Hong, Alexander Jonkeren, Mohammed Khalil, David W. Martin, William Pendrill, Benjamin Pumphrey, Austin Rothermich, Arttu Sainio, Andres Stenner, Christopher Tanner, Melina Thévenot, Nikita V. Voloshin, Jim Walla, and Zbigniew Wędracki

2021 The Astrophysical Journal Supplement Series 253 7.

  • Provider: AAS Journals

Caption: Figure 31.

Simulated age distributions for each of the 150 K Teff bins. (a) The single power law of α = 0.5 coupled with the Saumon & Marley (2008) evolutionary tracks. (b) The same, but coupled with the Baraffe et al. (2003) evolutionary tracks. Because the Saumon & Marley (2008) models do not extend below 300 K, the bin in the lower right of panel (a) is empty. For ease of comparison, the same x and y scaling is used for all subpanels. The colored triangles along the bottom edge of each subpanel show the median age for cutoff masses of 10MJup (blue), 5MJup (green), and 1MJup (red); these triangles overlap in all but the coldest bins.

Other Images in This Article

Show More

Copyright and Terms & Conditions