Image Details
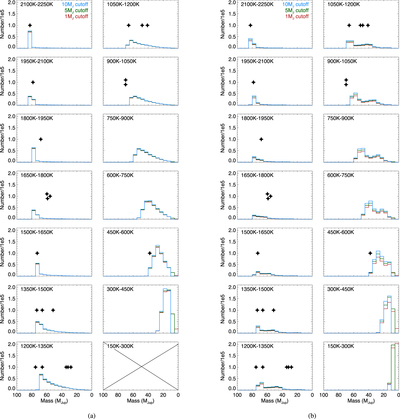
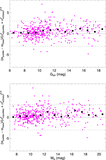
Caption: Figure 30.
Simulated mass distributions for each of the 150 K Teff bins. (a) The single power law of α = 0.5 coupled with the Saumon & Marley (2008) evolutionary tracks. (b) The same, but coupled with the Baraffe et al. (2003) evolutionary tracks. Because the Saumon & Marley (2008) models do not extend below 300 K, the bin at lower right in panel (a) is empty. For ease of comparison, the same x and y scaling is used for all subpanels. Objects from Table 16 that have dynamically measured masses (filled black stars) are plotted in their Teff bins at the x location corresponding to their mass; their y positions are arbitrary.
Other Images in This Article


Show More
Copyright and Terms & Conditions
© 2021. The American Astronomical Society. All rights reserved.