Image Details
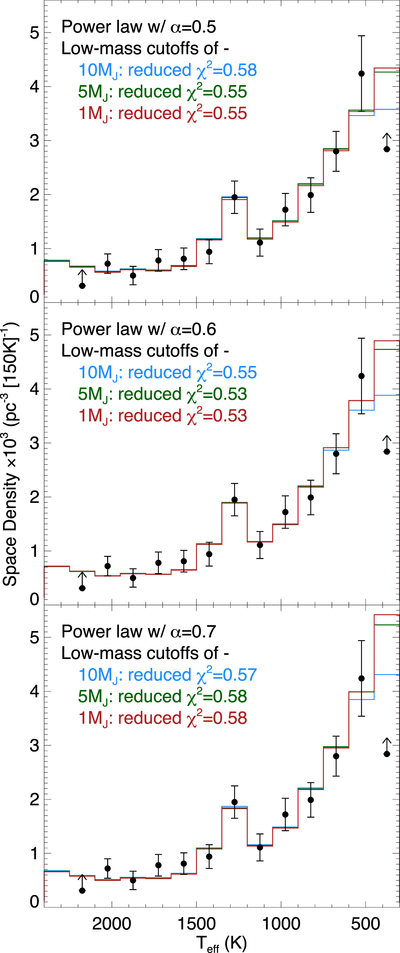
Caption: Figure 29.
Fits of power laws with α = 0.5 (top panel), α = 0.6 (middle panel), and α = 0.7 (bottom panel) to our observational data (black points). These predicted Teff distributions have been passed through the evolutionary models of Saumon & Marley (2008). Each panel shows simulations for three low-mass cutoffs: 10 MJup (blue), 5 MJup (green), and 1 MJup (red). The minimum reduced χ2 values are found for the α = 0.6 model.
Other Images in This Article


Show More
Copyright and Terms & Conditions
© 2021. The American Astronomical Society. All rights reserved.
Copyright ©
2025 Astronomy Image Explorer. All Rights Reserved.