Image Details
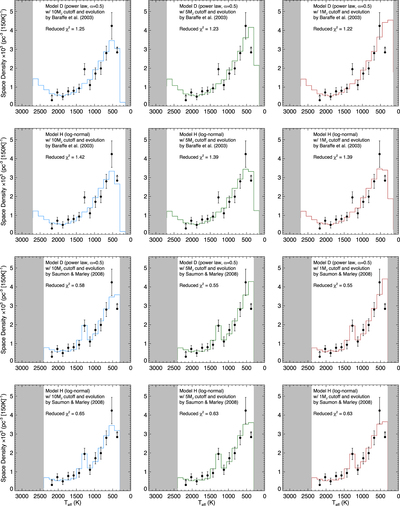
Caption: Figure 28.
Best fits between the simulations and our measured space densities. Of the simulations that use the evolutionary tracks of Baraffe et al. (2003), the two with the smallest reduced χ2 values are shown in the top two rows. Of the simulations that use the evolutionary tracks of Saumon & Marley (2008), the two that provide the best fits are show in the two bottom rows. “Model D” refers to the power law with α = 0.5, and “Model H” refers to the single-object log-normal form of Chabrier (2001). See Kirkpatrick et al. (2019a) for additional information on these simulations. Each row shows the same model with a different low-mass cutoff: 10MJup (blue) in the left panel, 5MJup (dark green) in the middle panel, and 1MJup (red) in the right panel. Our measured space densities and their uncertainties are shown in black. Gray zones denote areas not covered by the simulations.
Other Images in This Article


Show More
Copyright and Terms & Conditions
© 2021. The American Astronomical Society. All rights reserved.