Image Details
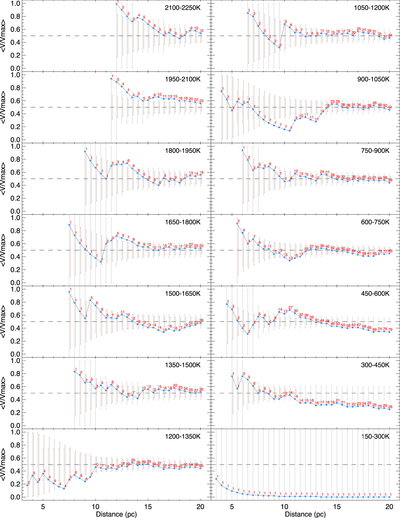
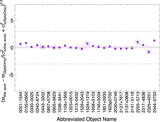
Caption: Figure 23.
Average ﹩V/{V}_{\max }﹩ value in 0.5 pc intervals for fourteen 150-K bins encompassing our 20 pc L, T, and Y dwarf census. Blue dots represent our empirical sample. Red labels mark the number of objects in the computation at each 0.5 pc interval. Black dashed line shows the ﹩\langle V/{V}_{\max }\rangle =0.5﹩ level indicating a complete sample. Gray error bars show the approximate 1σ range around ﹩\langle V/{V}_{\max }\rangle ﹩ = 0.5 that a complete sample of the size indicated by the red number would exhibit, given random statistics. Brown error bars, offset by +0.05 pc from the gray error bars for clarity, show the 1σ variation around 0.5 obtained by 10,000 Monte Carlo simulations having the number of objects and completeness limit listed in Table 15.
Other Images in This Article


Show More
Copyright and Terms & Conditions
© 2021. The American Astronomical Society. All rights reserved.