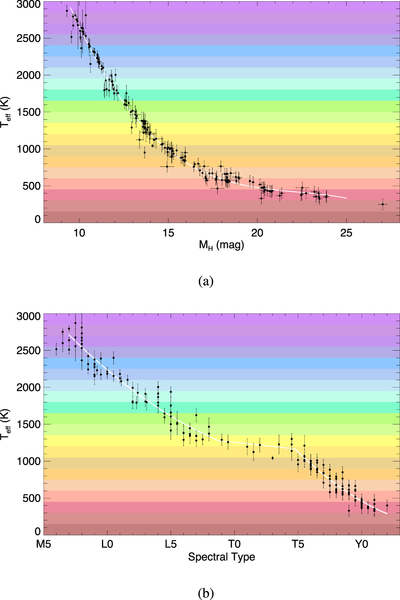
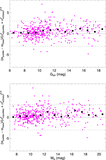
Image Details

Choose export citation format:

The Field Substellar Mass Function Based on the Full-sky 20 pc Census of 525 L, T, and Y Dwarfs

  • Authors: J. Davy Kirkpatrick, Christopher R. Gelino, Jacqueline K. Faherty, Aaron M. Meisner, Dan Caselden, Adam C. Schneider, Federico Marocco, Alfred J. Cayago, R. L. Smart, Peter R. Eisenhardt, Marc J. Kuchner, Edward L. Wright, Michael C. Cushing, Katelyn N. Allers, Daniella C. Bardalez Gagliuffi, Adam J. Burgasser, Jonathan Gagné, Sarah E. Logsdon, Emily C. Martin, James G. Ingalls, Patrick J. Lowrance, Ellianna S. Abrahams, Christian Aganze, Roman Gerasimov, Eileen C. Gonzales, Chih-Chun Hsu, Nikita Kamraj, Rocio Kiman, Jon Rees, Christopher Theissen, Kareem Ammar, Nikolaj Stevnbak Andersen, Paul Beaulieu, Guillaume Colin, Charles A. Elachi, Samuel J. Goodman, Léopold Gramaize, Leslie K. Hamlet, Justin Hong, Alexander Jonkeren, Mohammed Khalil, David W. Martin, William Pendrill, Benjamin Pumphrey, Austin Rothermich, Arttu Sainio, Andres Stenner, Christopher Tanner, Melina Thévenot, Nikita V. Voloshin, Jim Walla, and Zbigniew Wędracki

2021 The Astrophysical Journal Supplement Series 253 7.

  • Provider: AAS Journals

Caption: Figure 22.

Plots showing the trend of absolute H-band magnitude with effective temperature (a) and spectral type with effective temperature (b), using the data (black points) from Table 14. Functional fits to the trends, shown by the white curves, can be found in Table 13. The colored bands in each plot depict each of the 150 K-wide temperature bins into which the data will be sorted in the following section.

Other Images in This Article

Show More

Copyright and Terms & Conditions