Image Details
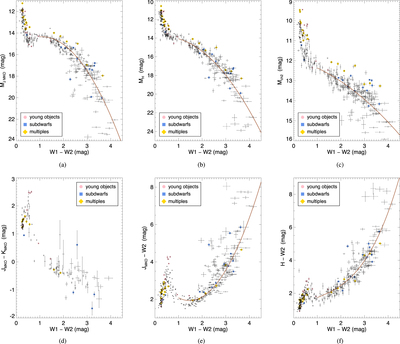
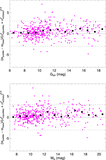
Caption: Figure 19.
Plots of various absolute magnitudes (a)–(c) and colors (d)–(f) as a function of W1 − W2 color. Only members of the 20 pc census are shown, and plots (a)–(c) show only the subset of 20 pc objects having parallaxes measured to better than 12.5%. Polynomial fits that exclude known young objects (pink circles, Section 7.1), subdwarfs (blue squares, Section 7.2), and multiple systems (yellow diamonds, Section 7.3) are shown in brown and described in Table 13. In panels (a)–(c), the fits include only those points with W1 − W2 > 1.0 mag, and in panels (e) and (f), the fits include only those points with W1 − W2 > 0.8 mag.
Other Images in This Article


Show More
Copyright and Terms & Conditions
© 2021. The American Astronomical Society. All rights reserved.