Image Details
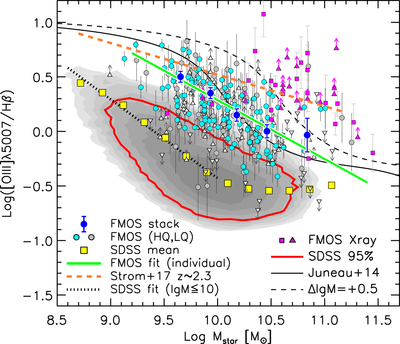
Caption: Figure 36.
The MEx diagram: M* vs. [O III] λ5007/Hβ. The FMOS galaxies in Sample-HJ are compared with the SDSS sample. Symbols are the same as in Figure 34. The solid green line indicates the best-fit linear relation for the FMOS galaxies, and the orange dashed line is the best-fit relation for the KBSS-MOSFIRE sample at z ∼ 2.3 (Strom et al. 2017). The thin dashed curves indicate the divisions between star-forming/composite galaxies and AGNs at z ∼ 0 (Juneau et al. 2014).
Other Images in This Article


Show More
Copyright and Terms & Conditions
© 2019. The American Astronomical Society. All rights reserved.
Copyright ©
2025 Astronomy Image Explorer. All Rights Reserved.