Image Details
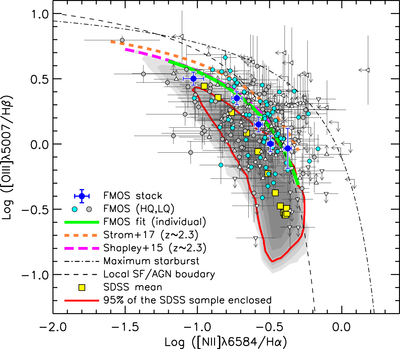
Caption: Figure 34.
The N2-BPT diagram: log [N II] λ6584/Hα vs. log [O III] λ5007/Hβ. The FMOS galaxies in Sample-HJ are plotted. Objects with detections of all four lines are shown with circles and divided into two groups: HQ (cyan) and LQ (gray). For other objects, the arrows and triangles indicate the 2σ upper and/or lower limits. Large blue circles indicate the FMOS stacked measurements in five mass bins (with the median M* increasing from left to right). A green line indicates the best-fit curve to the FMOS galaxies (Equation (16)). The shaded contours indicate the distribution of the SDSS sample in log scale, and the red contour encloses 95% of the SDSS galaxies. Yellow squares indicate the stacked line ratios of the SDSS galaxies in bins of M* in the range 108.6 ≤ M* ≤ 1011.2. Thin dashed and dot-dashed curves indicate the empirical separation between star-forming galaxies and AGNs for the SDSS sample (Kauffmann et al. 2003a) and the theoretical “maximum starburst” limit (Kewley et al. 2001), respectively. In addition, the best-fit relations at z ∼ 2.3 are shown (orange dashed line, Strom et al. 2017; magenta dashed line, Shapley et al. 2015).
Other Images in This Article


Show More
Copyright and Terms & Conditions
© 2019. The American Astronomical Society. All rights reserved.