Image Details
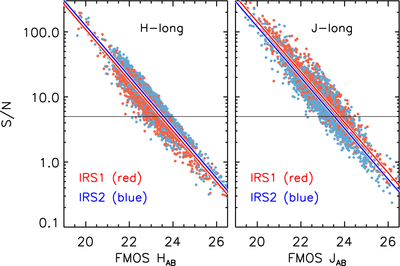
Caption: Figure 7.
Observed magnitude from the FMOS H-long (left panel) and J-long (right panel) spectra vs. the estimated S/N. The data from IRS1 and IRS2 are shown separately with red and blue, respectively. The solid lines are linear fits to the data, and the horizontal lines indicate the threshold S/N = 5.
Other Images in This Article


Show More
Copyright and Terms & Conditions
© 2019. The American Astronomical Society. All rights reserved.
Copyright ©
2025 Astronomy Image Explorer. All Rights Reserved.