Image Details
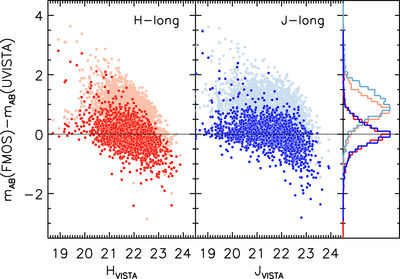
Caption: Figure 9.
Difference between the observed (FMOS) and reference (UltraVISTA; Laigle et al. 2016) magnitudes for the H and J bands. The pale and bright color points correspond, respectively, to before and after the aperture correction was applied. The histograms show the distribution of the differential magnitudes separately for each band, as well as for before/after the correction.
Other Images in This Article


Show More
Copyright and Terms & Conditions
© 2019. The American Astronomical Society. All rights reserved.
Copyright ©
2025 Astronomy Image Explorer. All Rights Reserved.