Image Details
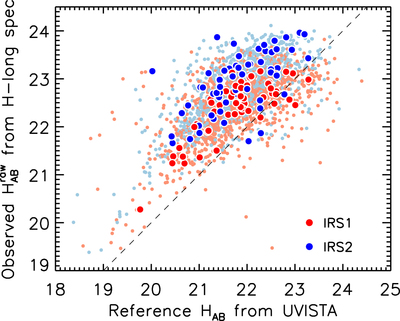
Caption: Figure 6.
Observed “raw” HAB from the H-long spectra vs. reference HAB from UltraVISTA. Red and blue points correspond to the measurements with the two spectrographs, IRS1 and IRS2, respectively. Data points from a single observing run (2013 December 28) are highlighted with large symbols. A global offset of ∼1 mag from the one-to-one relation (dashed line) reflects the average aperture loss, while an offset of ∼0.5 mag between IRS1 (red) and IRS2 (blue) is due to the differential total throughput of these spectrographs.
Other Images in This Article


Show More
Copyright and Terms & Conditions
© 2019. The American Astronomical Society. All rights reserved.
Copyright ©
2025 Astronomy Image Explorer. All Rights Reserved.