Image Details
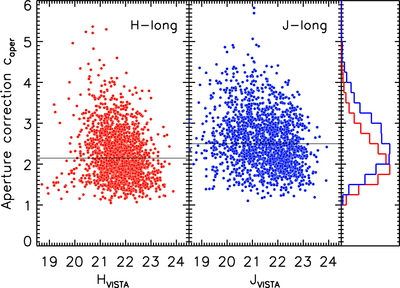
Caption: Figure 8.
Derived aperture correction factors caper as a function of the reference H or J magnitudes (Laigle et al. 2016). The horizontal solid lines mark the median values. Histograms show the distribution of caper separately for the H- long (red) and J-long (blue) bands.
Other Images in This Article


Show More
Copyright and Terms & Conditions
© 2019. The American Astronomical Society. All rights reserved.
Copyright ©
2025 Astronomy Image Explorer. All Rights Reserved.