Image Details
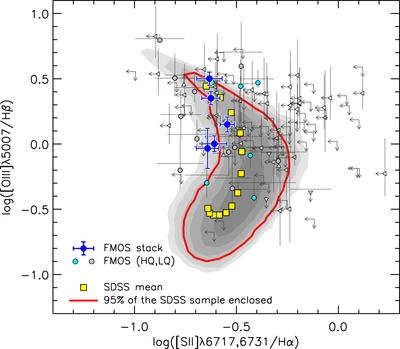
Caption: Figure 35.
The S2-BPT diagram: log [S II] λλ6717, 6731/Hα vs. log [O III] λ5007/Hβ. The FMOS galaxies in Sample-HJ are plotted in comparison with the SDSS galaxies. Symbols are the same as in Figure 34.
Other Images in This Article


Show More
Copyright and Terms & Conditions
© 2019. The American Astronomical Society. All rights reserved.
Copyright ©
2025 Astronomy Image Explorer. All Rights Reserved.