Image Details
Caption: Figure 23.
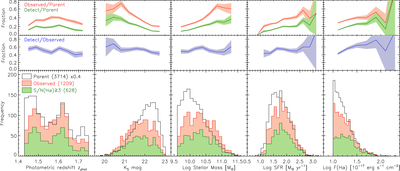
Same as Figure 22 but for the Selected-L16 sample (N = 3714) and the corresponding “∩ FMOS HL” (N = 1209) and Hα-detected (∩ FMOS HL + Hα; N = 628) samples (see Table 8). The open histograms are scaled by a factor of 0.4.
Other Images in This Article


Show More
Copyright and Terms & Conditions
© 2019. The American Astronomical Society. All rights reserved.
Copyright ©
2025 Astronomy Image Explorer. All Rights Reserved.