Image Details
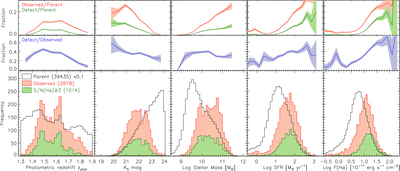
Caption: Figure 22.
Distribution of the SED-based photometric redshifts, KS magnitudes, stellar masses, SFRs, and predicted Hα fluxes (left to right). The open histograms show the distributions of the parent Broad-L16 sample (N = 39,435), scaled by a factor of 0.1, while the filled red and green histograms indicate the observed (∩ FMOS HL; N = 2878) and Hα-detected (∩ FMOS HL + Hα; N = 1014) samples (see Table 8). In the top panels, the fraction of the observed and Hα-detected samples relative to the parent sample is shown for each quantity. In the middle panels, the fraction of the Hα-detected sample to the observed sample is shown. In the top and middle panels, the shaded regions indicate the Poisson errors in each bin.
Other Images in This Article


Show More
Copyright and Terms & Conditions
© 2019. The American Astronomical Society. All rights reserved.