Image Details
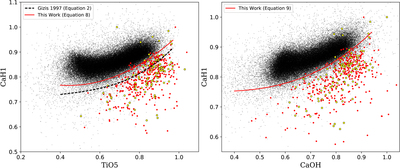
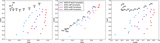
Caption: Figure 9.
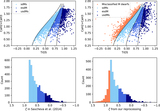
To separate M subdwarfs from M dwarfs on the [TiO5, CaH1] and [CaOH, CaH1] index diagrams, we plot the visually identified M dwarfs as black dots, the “labeled” subdwarf sample as red dots (see Section 4.1), and the subdwarfs identified by Bai et al. (2016) as yellow dots. We define two separator lines (i.e., Equations (8) and (9)) as red solid curves. The dashed black curve on the left panel is the dwarf–subdwarf separator relation originally proposed by Gizis (1997), which does not appear suitable for LAMOST data.
Other Images in This Article
Copyright and Terms & Conditions
© 2019. The American Astronomical Society. All rights reserved.
Copyright ©
2025 Astronomy Image Explorer. All Rights Reserved.