Image Details
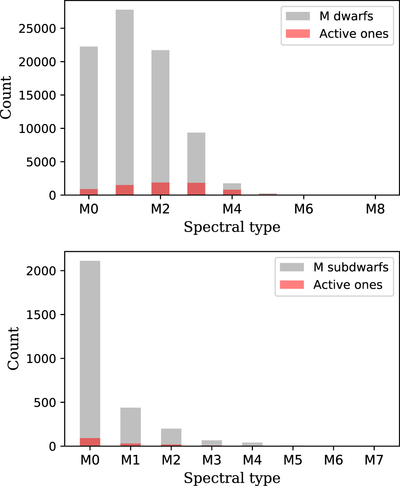
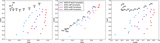
Caption: Figure 10.
SpT distribution of visually identified M dwarfs (83,213 in total, top panel) compared with SpT distribution of subdwarfs (bottom panel). The magnetic activity fraction for each spectral subtype, detected by Hα emission following the precepts of West et al. (2011), is shown as red bars. We found 7075 active M dwarfs and 141 M subdwarfs. The figure shows that the magnetic activity fraction is a function of the spectral type for M dwarfs, which is consistent with former studies (West et al. 2011). For subdwarfs, the active subsample remains too small to draw a reliable conclusion.
Other Images in This Article
Copyright and Terms & Conditions
© 2019. The American Astronomical Society. All rights reserved.
Copyright ©
2025 Astronomy Image Explorer. All Rights Reserved.