Image Details
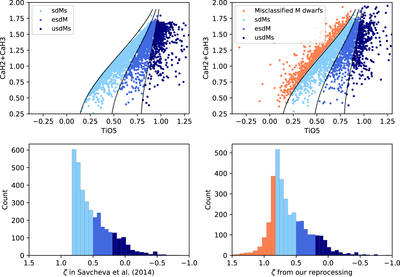
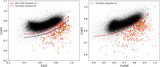
Caption: Figure 4.
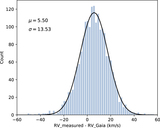
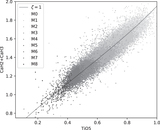
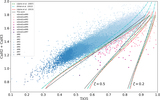
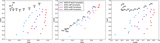
Sensitivity of the spectral classification indicators to the spectrum rest-frame reduction accuracy. The two left panels show the distribution of spectral indices and ζ parameter taken from the large subdwarf catalog of S14. They are based on spectra reduced with RVs from West et al. (2011), obtained by cross-correlation with ordinary M-dwarf templates. The subdwarfs are selected from dwarfs using ζ < 0.825 and were further divided into sdM (light blue), esdM (blue), and usdM (dark blue) based on decreasing ζ values. The right panels show our reprocessing of the S14 sample using the set of RVs (also provided by S14, but not used by them) based on cross-correlation with purposely built subdwarf templates. The orange dots represent 744 objects that escape the selection criterion and have ζ > 0.825, which makes them probable misclassified ordinary dwarfs.
Other Images in This Article
Copyright and Terms & Conditions
© 2019. The American Astronomical Society. All rights reserved.