Image Details
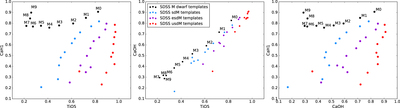
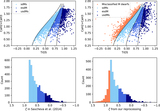
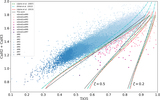
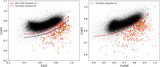
Caption: Figure 8.
Three panels compare the M-dwarf template spectra built by Bochanski et al. (2007) from the Sloan Digital Sky Survey (SDSS) with M-subdwarf template spectra (sdM/esdM/usdM) built by S14, also from SDSS, on the [TiO5, CaH1], [TiO5, CaOH], and [CaOH, CaH1] index diagrams, respectively. The left panel shows that M subdwarfs are clearly separated from dwarfs by the CaH1–TiO5 index couple. The central panel shows that the CaOH index variation is consistent with that of the TiO5 index, leading to similar results between CaH1 vs. TiO5 (left panel) and CaH1 vs. CaOH (right panel) distributions. A CaOH–CaH1 relation can thus be defined on the [CaOH, CaH1] index diagram to separate subdwarfs from dwarfs.
Other Images in This Article
Copyright and Terms & Conditions
© 2019. The American Astronomical Society. All rights reserved.