Image Details
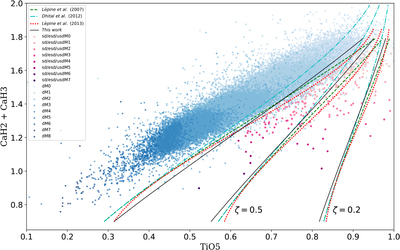
Caption: Figure 7.
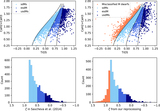
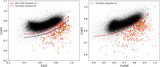
New calibration of the ζ parameter used for subdwarf selection and classification. We plot the ordinary M-dwarf sample (83,213 objects) as blue dots and the “labeled” subdwarf sample (433 objects) as pink dots (see Section 4.1) in a [TiO5, CaH2+CaH3] index diagram. The final condition we adopt to classify a target as a “subdwarf” is ζ < 0.75 (plotted as the solid black curve), because it can exactly cover most of our “labeled” subdwarf sample and excludes more than 98% of the M dwarfs. The iso-ζ contours from the earlier calibrations of Lépine et al. (2007), Dhital et al. (2012), and Lépine et al. (2013) are also shown for comparison as dashed, dashed–dotted, and dotted lines, respectively. The iso-ζ curves used to separate subdwarfs from dwarfs in the three former systems correspond to ζ < 0.825, as shown in the figure (all different from each other due to the sample selection bias). We formally adopt ζ < 0.5 and ζ < 0.2 as separators between sdM, esdM, and usdM, following the former systems.
Other Images in This Article
Copyright and Terms & Conditions
© 2019. The American Astronomical Society. All rights reserved.