Image Details
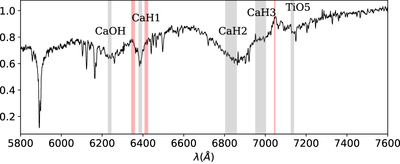
Caption: Figure 2.
Template esdM spectrum in the rest frame. The wavebands used to calculate the spectral indices are marked by the translucent gray bands, corresponding to the “fea_” features in Table 3, and the bands marked in red show the “cont_” features used as pseudo-continuum.
Other Images in This Article
Copyright and Terms & Conditions
© 2019. The American Astronomical Society. All rights reserved.
Copyright ©
2025 Astronomy Image Explorer. All Rights Reserved.