

Image Details
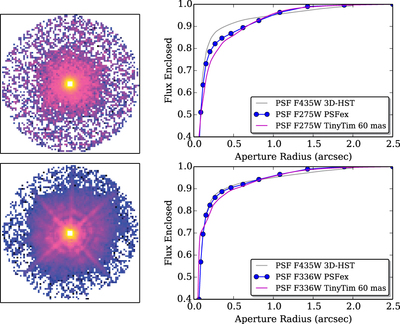
Caption: Figure 7.
PSFs of the HDUV data. The left panels show stamps of the F275W (top) and F336W (bottom) PSFs. Images are 5″ on a side. The right panels compare the PSF-enclosed flux with the B435-band PSF, as well as with the theoretically determined TinyTim PSFs of the corresponding WFC3/UVIS filters. The PSFs for the two fields are very consistent with each other.
Other Images in This Article
Copyright and Terms & Conditions
© 2018. The American Astronomical Society. All rights reserved.

Copyright ©
2026 Astronomy Image Explorer. All Rights Reserved.
