

Image Details
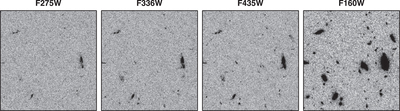
Caption: Figure 5.
Examples of images from the HDUV (left two panels; F275W and F336W) and ancillary data (right two panels; F435W and F160W) in the GOODS-south field. The images are 0.5 arcmin on a side. Note the flat background in the WFC3/UVIS data, which was only achieved after subtraction of the sky dark. Clearly, the surface density of sources decreases to shorter wavelengths as the average galaxy exhibits a relatively red color, and sources at z ≳ 1.7 start to disappear from the UV imaging due to the Lyman break (see Figure 2). The low number density of UV-bright sources and the very high incidence of cosmic rays make it particularly challenging to align such UV imaging data (see Section 4.5).
Other Images in This Article
Copyright and Terms & Conditions
© 2018. The American Astronomical Society. All rights reserved.

