

Image Details
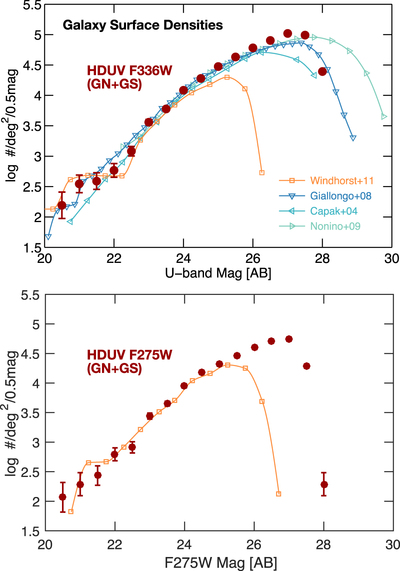
Caption: Figure 10.
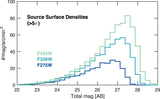
Comparison of the U/F336W-band (top) and F275W (bottom) surface densities of sources measured with different surveys. The surface densities based on the HDUV F336W and F275W filter imaging are shown as dark red dots (with Poisson error bars). The orange squares and lines represent the F336W /F275W surface density measured in the ERS data (Windhorst et al. 2011), while all the other lines correspond to ground-based U-band imaging surveys covering larger areas (Capak et al. 2004; Giallongo et al. 2008; Nonino et al. 2009). The latter cover slightly longer central wavelengths (λc ∼ 3600–3800 Å) compared to λc = 3350 Å of F336W, and they all have a much wider PSF (>8×). The curves turn over at faint magnitudes, since no completeness corrections have been applied. The magnitudes correspond to total fluxes.
Other Images in This Article
Copyright and Terms & Conditions
© 2018. The American Astronomical Society. All rights reserved.

