

Image Details
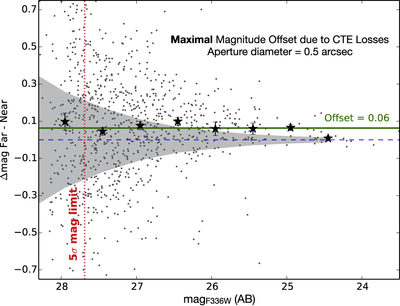
Caption: Figure 3.
Measured magnitude differences of galaxies within 0.″5 apertures when observed close to the readout (i.e., with few charge transfers, ≲600), compared to when observed far from readout (i.e., with many charge transfers, ≳1500) as a function of total F336W magnitude. Small dots correspond to individual measurements, while stars represent binned median values. The difference is measured in individual CTE-corrected stacks of epoch 1 and epoch 2 data in the GOODS-S field, which were obtained with a ∼90° offset in their position angle. The gray curve represents the expected scatter purely due to a decreasing signal-to-noise at fainter magnitude. The CTE correction works very well, resulting only in a median residual flux loss of ∼0.06 mag and in an additional scatter of ∼0.1 mag, which appears to be independent of magnitude. Given that these galaxies were selected to be the extreme cases, with the most charge transfers, the average galaxy in the field is expected to show a magnitude bias of less than 5%.
Other Images in This Article
Copyright and Terms & Conditions
© 2018. The American Astronomical Society. All rights reserved.

