Image Details
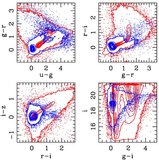
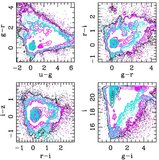
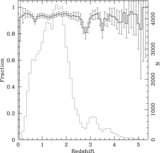
Caption: Figure 16.
Spectroscopic redshift distribution of known quasars in 11 different bins of photometric redshift. Bins are chosen to match those of the Richards et al. (2006) quasar luminosity function. Some photometric redshift bins are quite robust (e.g., 1.06 < z phot < 1.44), while others have large spreads or catastrophic errors (e.g., 2.5 < z phot < 3.0). The mean redshift of each bin is given in each panel along with the fraction of objects within the redshift range explored (top and bottom numbers, respectively).
Other Images in This Article
Show More
Copyright and Terms & Conditions
© 2009. The American Astronomical Society. All rights reserved.
Copyright ©
2025 Astronomy Image Explorer. All Rights Reserved.