Image Details
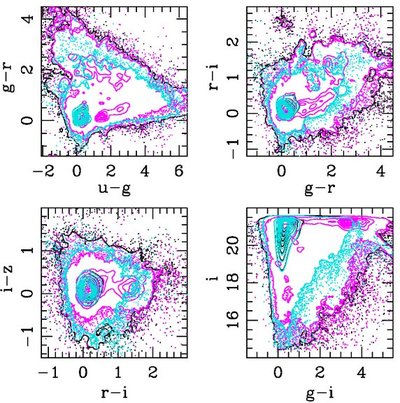
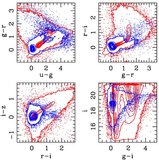
Caption: Figure 7.
Color–color and color–magnitude distribution of all quasar candidates in the catalog (black). Cyan contours indicate the most likely quasars good ⩾ 0, while magenta contours represent the most likely interlopers good ⩽ −2.
Other Images in This Article
Show More
Copyright and Terms & Conditions
© 2009. The American Astronomical Society. All rights reserved.
Copyright ©
2025 Astronomy Image Explorer. All Rights Reserved.