Image Details
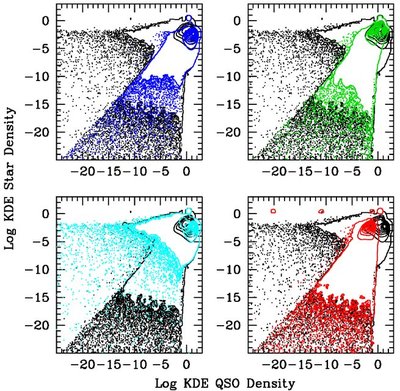
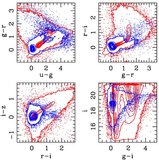
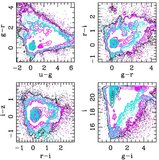
Caption: Figure 8.
Distribution of KDE star and quasar probability densities for all objects classified as quasars by one or more of the NBC methods. Black points and contours give the full sample (repeated in each panel). Low- z quasars are shown in blue, UVX in cyan, mid- z in green, and high- z in red. Note that the NBC selection by definition rejects objects with star probability greater than quasar probability, but the KDE values were determined for objects selected by any of the NBC methods, not only the overall NBC selection, so some objects appear above the diagonal.
Other Images in This Article
Show More
Copyright and Terms & Conditions
© 2009. The American Astronomical Society. All rights reserved.
Copyright ©
2025 Astronomy Image Explorer. All Rights Reserved.