Image Details
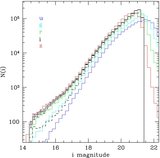
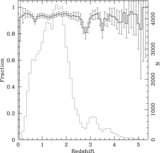
Caption: Figure 4.
Ratio of quasar candidates in the catalog to all point sources as a function of Galactic latitude ( b). The full sample (solid line); the most likely quasars, having good ⩾ 0 (dashed); and the least likely quasars, having good < 0 (dotted) are plotted. The sharp increase at the lowest b values is indicative of increased stellar contamination near the Galactic plane.
Other Images in This Article
Show More
Copyright and Terms & Conditions
© 2009. The American Astronomical Society. All rights reserved.
Copyright ©
2025 Astronomy Image Explorer. All Rights Reserved.