Image Details
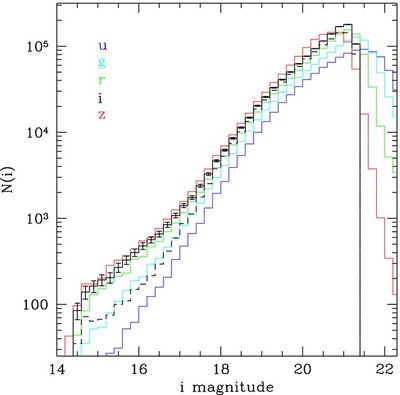
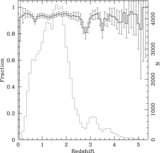
Caption: Figure 2.
i-Band magnitude distribution of the 1,172,157 quasar candidates (i.e., Tables 1 and 3 combined) in the catalog (solid black line). Colors show the magnitude distributions in the other bands to indicate where the relative limits are. The dashed black line is the i-band histogram for the most robust sources in the catalog, that is, limited to the good⩾ 0 objects in Table 1.
Other Images in This Article
Show More
Copyright and Terms & Conditions
© 2009. The American Astronomical Society. All rights reserved.
Copyright ©
2025 Astronomy Image Explorer. All Rights Reserved.