Image Details
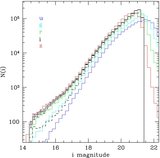
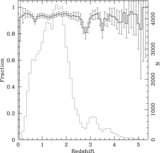
Caption: Figure 5.
E( B − V) distribtion. The top (solid) histogram represents the whole sample. The middle (dashed) histogram is for spectroscopically-confirmed quasars in the sample. The bottom (dotted) histogram shows spectroscopically-confirmed stars. The long dashed vertical lines indicate the A i < 0.3 and A i < 0.099 completeness limits.
Other Images in This Article
Show More
Copyright and Terms & Conditions
© 2009. The American Astronomical Society. All rights reserved.
Copyright ©
2025 Astronomy Image Explorer. All Rights Reserved.