Image Details
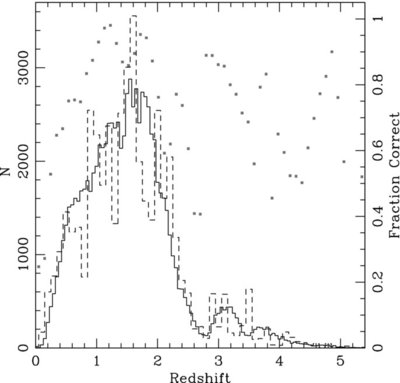
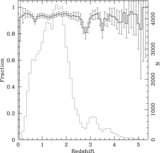
Caption: Figure 14.
Distribution of spectroscopic redshifts for confirmed quasars in the sample (solid line). The dashed line shows the photometric redshift distribution of the spectroscopically-confirmed quasars. The photometric redshifts are only as accurate as the size of the redshift bins that can be used to define the color–redshift relation, which coarsely quantizes the z phot distribution. Gray squares indicate the fraction of photo- z's that are correct to within ±0.3 for each z phot bin. These are most accurate where the most data exist (1 < z < 2).
Other Images in This Article
Show More
Copyright and Terms & Conditions
© 2009. The American Astronomical Society. All rights reserved.
Copyright ©
2025 Astronomy Image Explorer. All Rights Reserved.