Image Details
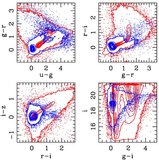
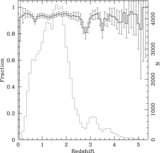
Caption: Figure 13.
Left: spectroscopic vs. photometric redshifts for all spectroscopically-confirmed quasars in the catalog. Right: histogram of the difference between spectroscopic and photometric redshifts. After rejecting outliers, the width of the distribution is σ = 0.239.
Other Images in This Article
Show More
Copyright and Terms & Conditions
© 2009. The American Astronomical Society. All rights reserved.
Copyright ©
2025 Astronomy Image Explorer. All Rights Reserved.