Image Details
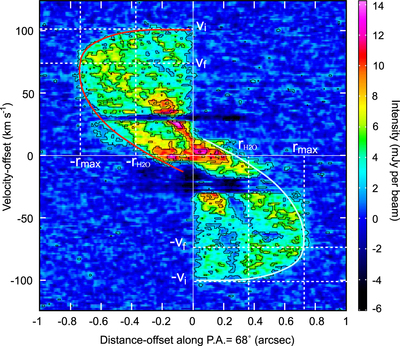
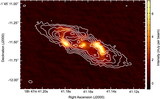
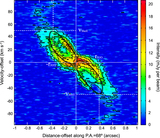
Caption: Figure 2.
PV diagram of the CO(J = 2 → 1) line emission from W43A. The PV diagram was obtained using a slit along PA = 68°. The velocity offset is defined with respect to the systemic velocity of the star Vsys = 34 km s−1. The horizontal white dashed lines indicate the maximum and minimum line-of-sight velocity offset of the emission that traces the jet (see the main text). The locus of the line-of-sight component of the velocity of the blueshifted and redshifted jet is indicated with light-blue and red solid lines, respectively. The vertical dashed lines indicate the maximum extent of the CO(J = 2 → 1) emission along PA = 68° and the approximate radius where the outer edge of the H2O maser clusters are located, respectively. The contours are drawn from 3σ on steps of 3σ (σ = 1 mJy beam−1).
Other Images in This Article
Copyright and Terms & Conditions
© 2020. The American Astronomical Society. All rights reserved.