Image Details
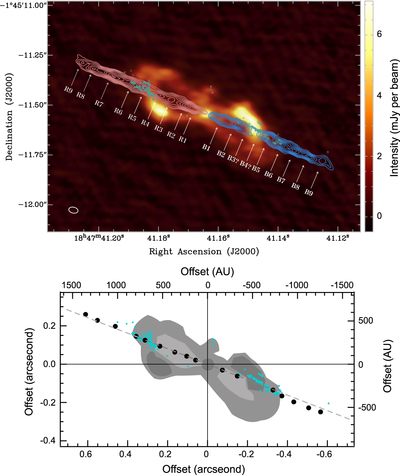
Caption: Figure 3.
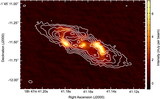
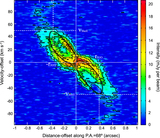
Upper panel: continuum and CO(J = 2 → 1) line emission from W43A. The blue and red contours indicate blueshifted and redshifted CO(J = 2 → 1) emission with velocity offsets >75 km s−1, tracing the jet. The contours are drawn from 3σ on steps of 3σ (σ = 15 mJy km s−1). The color map is the continuum emission at ∼230 GHz. Lower panel: diagram showing the location of the knots of the jet relative to the shell traced by the continuum emission. The origin is the location of the emission peak of the central continuum source: (J2000) R.A. = 18h47m41.ˢ164, decl. = −1°45′11.″54. The dashed line indicates a linear fit to the clumps in the inner region of the bipolar lobes. The knots of the blueshifted jet located outside the lobes deviate from the linear fit. In both panels the H2O masers found during 1994–2007 (Chong et al. 2015) and 2015 are indicated with dots in cyan color (see Appendix E for the details of the H2O maser observations).
Other Images in This Article
Copyright and Terms & Conditions
© 2020. The American Astronomical Society. All rights reserved.