Image Details
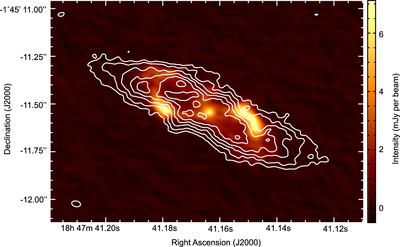
Caption: Figure 5.
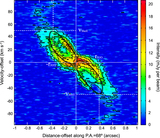
Continuum and p-H2S(﹩{J}_{{K}_{{\rm{a}}},{K}_{{\rm{c}}}}﹩ = 2 20 → 211) line emission from W43A. The contours represent H2S emission integrated over the velocity range −100 < Voffset(km s−1) < +100. The contours are (100, 200, 300, 400, 500, 600) mJy beam−1 km s−1 (σ = 35 mJy beam−1 km s−1). The ellipse at the bottom left corner represents the size of the synthesized beam θbeam = 0.″071 × 0.″048, PA = 86.°3. The color map is the continuum emission at ∼230 GHz.
Other Images in This Article
Copyright and Terms & Conditions
© 2020. The American Astronomical Society. All rights reserved.
Copyright ©
2024 Astronomy Image Explorer. All Rights Reserved.