Image Details
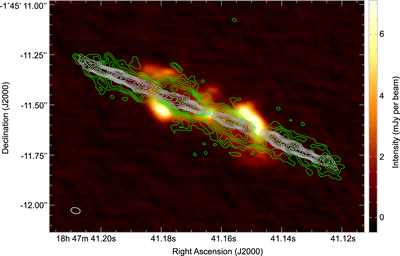
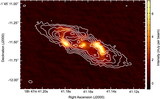
Caption: Figure 1.
Continuum and CO(J = 2 → 1) line emission from W43A. The green contours are CO(J = 2 → 1) emission integrated over the range of line-of-sight velocity offset ﹩| {V}_{\mathrm{offset}}(\mathrm{km}\,{{\rm{s}}}^{-1})| \lt 75﹩. The gray contours are CO(J = 2 → 1) emission integrated over the highest velocity range, ﹩75\lt | {V}_{\mathrm{offset}}(\mathrm{km}\,{{\rm{s}}}^{-1})| \lt 100﹩. The contours are drawn from 3σ on steps of 3σ (σ = 15 mJy beam−1 km s−1). The ellipse at the bottom left corner represents the size of the synthesized beam of the CO observations, θbeam = 0.″048 × 0.″031, PA = 74.°8. The color map is the continuum emission at ∼230 GHz and the corresponding synthesized beam is θbeam = 0.″047 × 0.″030, PA = 78.°1.
Other Images in This Article
Copyright and Terms & Conditions
© 2020. The American Astronomical Society. All rights reserved.