Image Details
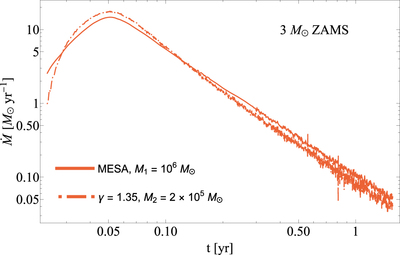
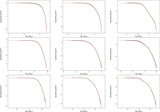
Caption: Figure 8.
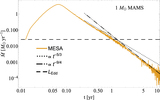
Fallback curve from the 3 M⊙, ZAMS MESA progenitor, with a BH mass of M1 = 106M⊙ (solid red; this curve is identical to the solid red curve shown in the bottom-left panel of Figure 4). The dotted–dashed curve shows the fallback rate from the tidal disruption of a γ = 1.35 polytrope, with its mass and radius matched to those of the MESA star. Here, however, we reduced the mass of the SMBH by the factor shown in Table 2, corresponding to a BH mass of M2 = 2 × 10⁵ M⊙, and we aligned the first time to half-max to that of the MESA fallback curve (i.e., we first “see” the TDE at the first-half-max). This figure demonstrates that we can reproduce the “data” obtained from the disruption of the MESA star extremely well with a polytrope, but with a BH mass that differs by nearly an order of magnitude from the true value.
Other Images in This Article
Copyright and Terms & Conditions
© 2019. The American Astronomical Society. All rights reserved.