Image Details
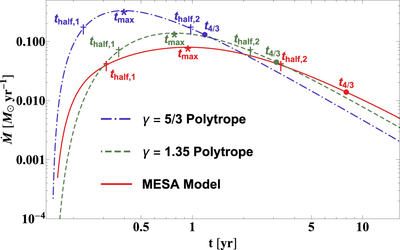
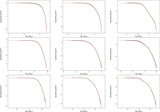
Caption: Figure 2.
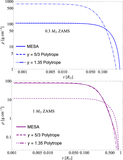
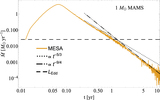
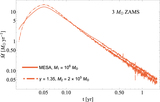
Fallback rate calculated using the frozen-in approximation, in Solar masses per year as a function of time in years, for the 1 M⊙, TAMS star, when the density profile is modeled as a γ = 5/3 polytrope (blue, dotted–dashed) and a γ = 1.35 polytrope (green, dashed); the solid red curve shows the fallback rate calculated from the MESA progenitor. Here the BH mass was set to 106 M⊙. The different points show characteristic times in the fallback rate, including the time taken to reach the peak (tmax, asterisks), to reach ﹩\dot{M}\propto {t}^{-4/3}﹩ (t4/3, bullets), and the time taken to reach half the peak fallback rate (which occurs on both the rise and the decay of the curve; respectively thalf,1 and thalf,2, crosses). It is apparent that, while each one of these stars possesses the same mass and radius, the density profile also plays a large role in generating differences between these characteristic timescales.
Other Images in This Article
Copyright and Terms & Conditions
© 2019. The American Astronomical Society. All rights reserved.