Image Details
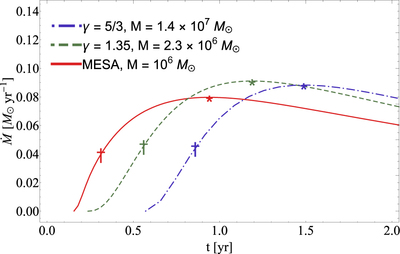
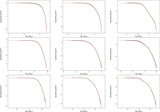
Caption: Figure 3.
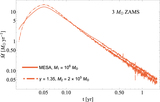
Fallback rate in Solar masses per year, as a function of time in years on a linear–linear scale, for the 1 M⊙, TAMS MESA progenitor, shown by the solid red curve, when the star is disrupted by a SMBH with mass ﹩M={10}^{6}{M}_{\odot }﹩ (and is therefore the same as the solid red curve in Figure 2). The dashed green curve and the dotted–dashed blue curve show the fallback rates for a γ = 1.35 and γ = 5/3 polytrope, respectively, when the stellar properties (mass and radius) are matched to those of the MESA progenitor. By changing the BH mass to the value shown in the legend, we are able to reproduce the time taken to go from half peak to peak, being tc = 0.63 yr. For each curve, this timescale is the time taken to go from the † to the ⋆.
Other Images in This Article
Copyright and Terms & Conditions
© 2019. The American Astronomical Society. All rights reserved.