Image Details
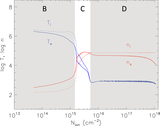
Caption: Figure 6.
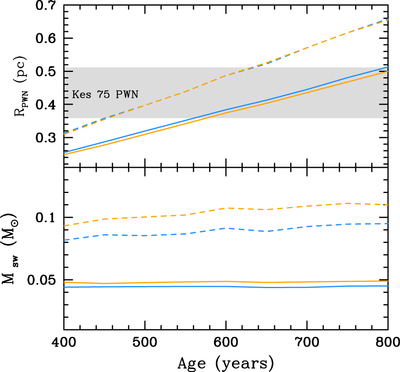
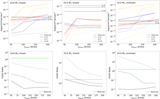
Results from the HD simulations based on two sets of model parameters listed in Table 4; the Bucciantini et al. (2011) model (blue curves) and the 10 M⊙ ZAMS progenitor model (orange curves). The dashed curves represent the case in which the early synchrotron losses by the particles in the PWN are completely ignored, while the solid curves represent the upper limit on the losses, derived assuming magnetic field properties similar to those inferred for the Crab Nebula at early stages (Gelfand et al. 2009). The top panel of the figure shows the evolution of the PWN radius with time, while the bottom panel shows the evolution of the swept-up SN ejecta mass. The gray band represents the range in the observed radius of the non-spherical PWN, taken to be 0.36–0.51 pc at a distance of 6.0 kpc assumed by Bucciantini et al. (2011). For more details, see Section 7.1.
Other Images in This Article
Copyright and Terms & Conditions
© 2019. The American Astronomical Society. All rights reserved.