Image Details
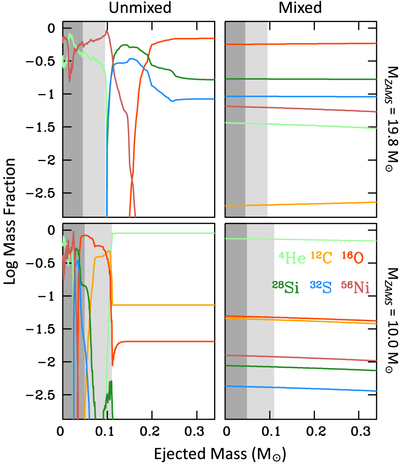
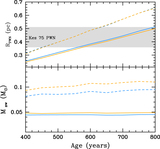
Caption: Figure 7.
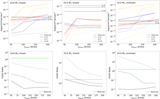
Mass profiles for the unmixed and mixed models of Sukhbold et al. (2016) for explosions of progenitors with ZAMS masses 19.8 M⊙ (top) and 10.0 M⊙ (bottom). The x-axes begin outside of the neutron star mass and reflect the material that has been ejected in the explosion. The gray bands represent the amount of mass that has so far been swept up by the PWN in Kes 75, as derived from the HD simulations for each progenitor case. The light gray bands represent the range in the total swept-up mass values assuming the extreme cases of no synchrotron losses and Crab-like synchrotron losses for the PWN, leading to a lower and upper limit on the swept-up ejecta mass of 0.045 and 0.085 M⊙ for the 19.8 M⊙ progenitor and 0.05 and 0.1 M⊙ for the 10.0 M⊙ progenitor, respectively (see Section 7.1).
Other Images in This Article
Copyright and Terms & Conditions
© 2019. The American Astronomical Society. All rights reserved.