Image Details
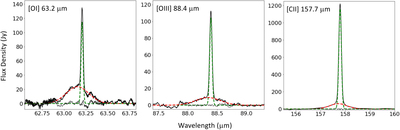
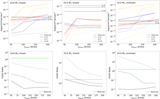
Caption: Figure 3.
Herschel PACS spectra covering the [O I] 63.2 μm, [O III] 88.4 μm, and [C II] 157.7 μm lines are shown in black. The spectra were extracted from the entire field of view shown in Figure 4. Each of the spectra were fitted with a two-component emission line model, a narrow component representing line emission from the background (green) and a broad component likely arising from the SN ejecta that surrounds the PWN (red). The best-fit parameters for each component are listed in Table 2.
Other Images in This Article
Copyright and Terms & Conditions
© 2019. The American Astronomical Society. All rights reserved.
Copyright ©
2024 Astronomy Image Explorer. All Rights Reserved.