Image Details
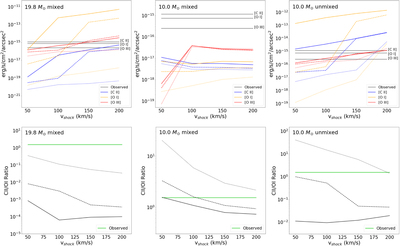
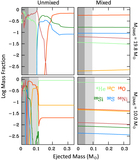
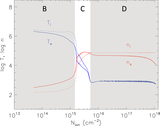
Caption: Figure 9.
Top row: modeled line intensities for the [C II] 157.7 μm (blue), [O I] 63.2 μm (orange), and [O III] 88.4 μm (red), corresponding to the three different cases (see Section 7.2) with compositions listed in Table 6 and plotted in Figure 7. The dotted, dashed, and solid lines represent pre-shock mass densities of ρ = 8.4 × (10−23, 10−22 and 10−21) g cm−3, respectively. The horizontal gray lines represent the observed line intensities. Bottom row: the modeled [C II]/[O I] line ratios for the three different densities (black lines) and the observed ratio (green line).
Other Images in This Article
Copyright and Terms & Conditions
© 2019. The American Astronomical Society. All rights reserved.
Copyright ©
2024 Astronomy Image Explorer. All Rights Reserved.