Image Details
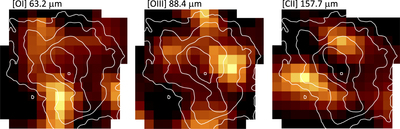
Caption: Figure 4.
Emission line maps integrated over the broad spectral line components of [O I], [O III], and [C II] that arise from SN ejecta (red components in Figure 3) and excluding the narrow-line emission from the background (green components in Figure 3). White contours represent the Chandra X-ray emission from the PWN. All three lines show distinctive peaks within the contours of the PWN.
Other Images in This Article
Copyright and Terms & Conditions
© 2019. The American Astronomical Society. All rights reserved.
Copyright ©
2024 Astronomy Image Explorer. All Rights Reserved.